Plot Customization
TGCat provides a GUI-like interface for the customization of spectral plots of both individual and combined spectra. Spectral orders can be combined or plotted separately as well as binned. A user can select from a range of different plot units and optional log scales, choose plotting limits, whether or not to display error bars, and can optionally request an ASCII dump out of the plot data to easily load into their desired plotting program without having to obtain larger file sets. Additionally, one can choose to save their set parameters by checking "Save Current Parameters" before replotting. Parameters will be saved for four hours.
Getting There
There are three types of custom plotting provided in TGCat: Plotting individual extraction spectra, combined spectra from multiple extractions, and multiple extraction spectra (which opens one or more individual plots in new tabs). If you have saved a set of parameters you can choose to open any of the plots with either these or the default values. If your saved parameters were set under a different detector and grating, certain saved parameters may not be applicable and the default values will be used in these cases.Note: if you have saved parameters in one screen, but the saved parameters option is not avaliable from the menu, or the "Use Saved Parameters" box on another plot is not selectable, you may need to first refresh the page.
To get to the plotter, one of the following paths is necessary:
-
Individual plotting:
From the data results page click on either 'V&V' link or the object name column for your desired extraction.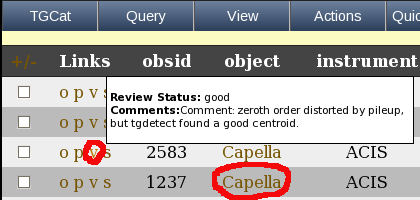
This will take you to the summary preview page showing premade spectral and imaging plots. Then follow the "View->Custom Plotting->Open Plotter" menu to start the plotting interface.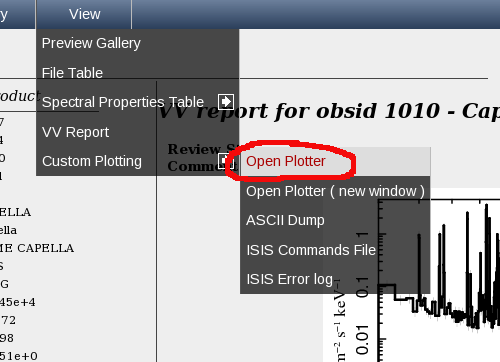
The plotter can also be opened in a new window if desired using "View->Custom Plotting->Open Plotter ( new window )".
-
Combined Plotting
From the data results page select one or more extractions by clicking on the data row or the checkbox at the left of each row. Please note that combined plotting is only supported for identical combinations of detector and grating, e.g. all ACIS/HETG. Now follow the menu "Actions->Plot ( Combined )".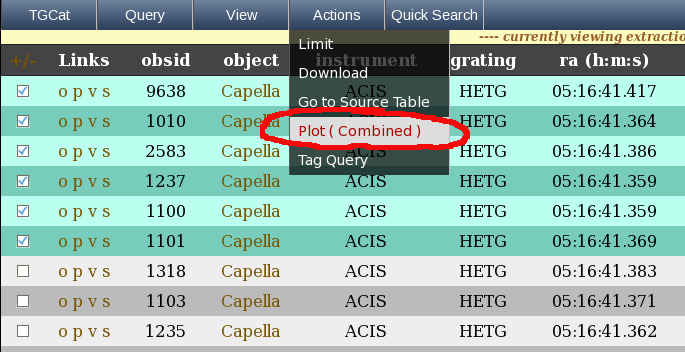
Important: Please be aware that the plot combined feature works using javascript to open a new window with your combined data. As such, please ensure that your browser will allow popups from TGCat, and that javascript is enabled
-
Multiple Plotting
From the data results page select one or more extractions by clicking on the data row or the checkbox at the left of each row and select the the menu item "Actions->Plot ( Multiple )". If you have saved plot parameters in one window, you can enable the "Use Saved Parameters" box by reloading the page with your browser.
Important: Please be aware that the plot multiple feature works using javascript to open a new window so please ensure that your browser will allow popups from TGCat, and that javascript is enabled
Bugs
Some browsers on some platforms do not properly display the ploting controls menus --- they sometimes are blank. Try any of the following:- Open the plot in a new window.
-"View -> Custom Plotting -> Open Plotter (new window)"
- Hover over a field to see if a "tool tip" identifies the field (such
as the "Plot Type").
- Select an item, then re-display the Plotting Controls to see if
the current selection shows
- Try using a different browser.
You are currently browsing guide: help/tgcat_help_plotting.html