The Results Page
TGCat stores information on each extraction and the resulting data products in a set of flexible MySQL tables. The results page presents the user with column information from these tables based on the search criteria. The user may choose to add relavent display columns, sort data by any available column, link to publications, obsid information and _SIMBAD target information. Data download requests, custom spectral plotting, further row filtering and other functions may also be performed from this page
Overview
The Results page is opened after pressing the submit button on the search page and presents the results of a TGCat database query using the entered search parameters. There are two types of Tables that can be accessed from a TGCat search: The first table to appear depends on the type of search performed. In general the Source Table will be given for any query whose parameters are not specific to an extraction, and the Extractions table will be given for any query whose parameters cannot be generalized for all extractions of it's target.The title box at the top of the page reports how many records ( if any ) were matched and returned. One row is listed in the data table for each row matched in the TGCat database, and either the default or user selected set of columns are displayed giving information on the Source or Extraction. The rows can be sorted by any displayed column by simply clicking the title of the column wherever it appears ( every ten rows a column header is displayed. Any one of these can be clicked to sort ). To sort the opposite direction simply click the desired column header twice.
Each row contains a set of links on the left hand side of the table and each link is coded by a single character and provides a tool tip eplaining where it goes. Several of the display columns also are links with tooltips describing their target ( please see the Table descriptions below for details on Links in each type of table ) Each row also has a checkbox on the far left hand column, when selected pressing the "Go" button will perfom the action selected in the radio buttons just above the "Go" button ( i.e. Clicking the "plot combined" radio button and pressing "Go" will open a plotting GUI combining spectra from all of the extractions whose checkbox are checked ). All of the checkboxes for the current data can be toggled using the "+/-" button in the header rows ( also requires javascript ).
The Extractions Data Table
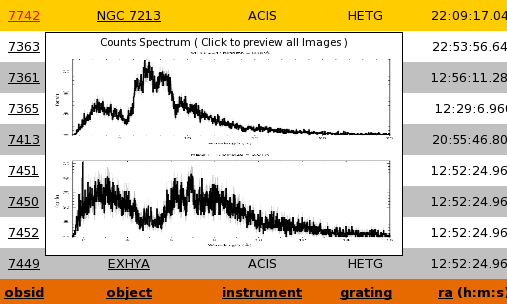
The Extractions Data Table is a list of unique TGCat extractions. An extraction is a single unit of TGCat processing, and contains it's own uniqe data products and measures. There may be multiple extractions for any given source. To view the unique source information ( source table ) for a given set of extractions select the desired extraction(s) ( or none for all ) and select the "view sources" radio at the bottom of the page and hit "Go"Each row on the data table contains a wealth of information and resources relating to the extraction it represents. Each row also provides the user with a very quick way to preview the spectral data by way of a tool tip that displays a flux spectra plot of the extraction. Here is a quick reference to the links and actions available in the Extractions Table:
Obsid Column -- Provides a link to the TGCat summary page and gives the user a quick view of the flux spectrum
Object Column -- Also Provides a link to the TGCat summary page and gives the user a quick view of the flux spectrum
limit -- Pressing "Go" eliminates all rows from the table who have not been selected
Download -- Pressing "Go" brings up a dialog allowing the user to schedule a download request
Plot Combined -- Pressing "Go" opens the plotting GUI combining spectra from all selected extractions
- A set of Links in each row provide the user with as much information as possible in a
straightforward and non-imposing manner, limiting the amount of clutter presented with
each query yet maximizing the usefulness of the results
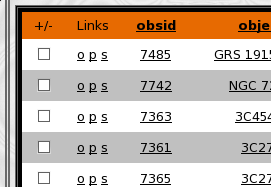
o -- Provides a link to the Obscat Data Page displaying observational parameters for the obsid this extraction is in
p -- Is a link to an ADS ( NASA Astrophysical Data System ) publication search on the _Chandra obsid this extraction is in
v -- Mouse over to see the VV status and comments, Click to go to the review page with VV report
s -- Is a link to a _SIMBAD indentifier query using the "object" field in the TGCat database - Mousing over one of the Obsid or Object Column links displays a tooltop
with a counts specta plot for quick preview. Clicking the link will open the summary/custom plotting page
- Each column header is also a link that when clicked will sort the table by that column in ascending or descending order. Clicking it more than once will reverse the behaviour. A tip will let the user know which order will result from a click. Please see Sorting Data for more information
The Source Data Table
The source data table is contains a list of TGCat sources. Any one TGCat source has at least one extraction in the TGCat archive and may have mutiple. To view the extractions for one or more of the sources select the desired source(s) ( or none for all ) and choose the "view extractions" radio button at the botton of the page and hit "Go"Note At present there are no data products directly tied to a TGCat source, however future plans include the archiving of combined products
The source table has the following features ( similar to extractions table ):
- The source table, like the extractions table, provides links for the user
s -- Is a link to a _SIMBAD indentifier query using the "object" field in the TGCat database
b -- Searches BiRD ( XMM RGS Catalog ) on the SIMBAD identifier
d -- Starts a DataScope ( NVO ) cone search centered on the SIMBAD identifier coordinates with a search radius ( SR ) equal to 0.05 degrees - Each column header is also a link that when clicked will sort the table by that column in ascending or descending order. Clicking it more than once will reverse the behaviour. A tip will let the user know which order will result from a click. Please see Sorting Data for more information
Changing Display Columns
The TGCat database tables store a wide variety of information about each extraction in the form of column data. A user can select to customize the information that gets displayed for each query result. To do this from the results page click the button on the bottom of the page titled "Change Columns". This will popup a dialog box that looks something like: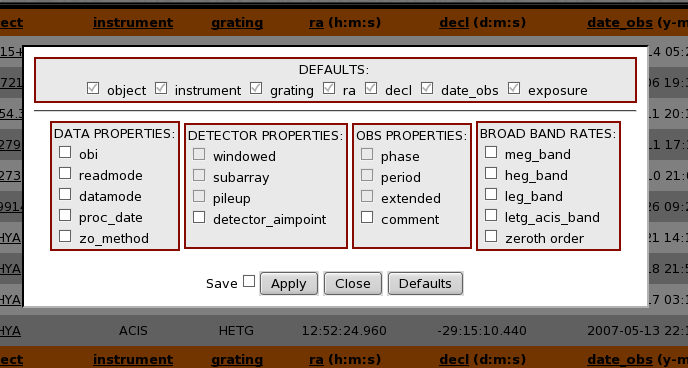
The available columns are organized by topic and can be selected/unselected for display by marking the appropriate checkbox and clicking "Apply". Assuming you have cookies enabled, checking the Save box will keep your preferred column settings for future sessions and queries. Clicking "Close" returns you to the page as it appeared before getting the dialog ( i.e. no changes made ) and clicking "Defaults" show only the default TGCat columns ( these setting may also be saved ) as shown in the DEFAULTS column section
Sorting Data
In order to efficiently browse queried data, TGCat provides the user with several ways to sort retrieved table data. Initially, when the table is displayed it is sorted by the "object" column in ascending alphabetical order ( even if the user chooses not to display the "object" column ). In each of the header columns there are three links that can be used to alter the sort:- Colum Name: The column name in the header will clear any existing sorting, sort by that column either ascending or descending order, and will toggle it's function for the next click
- Up arrow (
 ): This will add it's respective column to the sorting in descending order
- Down arrow (
 ): This will add it's respective column to the sorting in ascending order
you searched the entire catalog ( obsid="%" ) and would like sort by several of the returned columns:
first by detector, then by grating, then by object, and finally by exposure, so that for a group of the
same detector,grating,and object the top most entry has the largest exposure.
First, reset the order as detector in ascending alphabetical order by clicking the "detector" column
header twice ( it will start out with desc, twice to toggle ). Now the data list should show ACIS
extractions first and HRC last. Then to add the grating order again alphabetically ascending we will
click the ![]() link to the right of the column header "grating". Now we see that all ACIS HETG extractions
appear first, then ACIS LETG and finally HRC LETG. Lets add the object sort by clicking the
link to the right of the column header "grating". Now we see that all ACIS HETG extractions
appear first, then ACIS LETG and finally HRC LETG. Lets add the object sort by clicking the ![]() for
the "object" header effectivly grouping similar objects under detector/grating combinations. Finally,
lets see, for each object, which has the larget and smallest exposures by clicking the
for
the "object" header effectivly grouping similar objects under detector/grating combinations. Finally,
lets see, for each object, which has the larget and smallest exposures by clicking the ![]() to the
left of the "exposure" header, which will sub-sort exposure in descending time.
to the
left of the "exposure" header, which will sub-sort exposure in descending time.
Download Data
One of the key features of TGCat is the ability to download analysis ready event and spectral data products. Pre-computed summary products are also available for download.To download, follow these quick steps:
- Search the Catalog
- Select one or more extractions from the extractions table for your search
- Select "Download" from the "Actions" menu
- A small dialog will appear prompting you for the desired product types for your selections ( described below )
- Once satisfied, optionally enter you email address for notification when your order is complete
- Hit the "Apply" button
- Look in the notification bar at the bottom of your screen to confirm your request
The available products are split into several categories, each one or more files for any given Grating type ( An "(H)" or "(L)" after the filename indicates that the product is only for HETG or LETG, respectively. )
-
OBSPAR evt0.par A "parameter file" - an ASCII file listing header keywords and values from the event file -
EVT2 evt2 The event file (level 2); this file is a FITS binary table, containing the grating coordinates, time, and other information for each good event. -
ARF leg_ .arf (L) The "Ancillary Response Files" (effective area) (ARF) for the LETG grating. " " is a diffraction order, -8 to 8 (excluding 0). heg_ .arf (H) The "Ancillary Response Files" (effective area) (ARF) for the HEG grating. " " is a diffraction order, either -1 or 1. meg_ .arf (H) The "Ancillary Response Files" (effective area) (ARF) for the MEG grating. " " is a diffraction order, either -1 or 1. -
RMF heg_ .rmf (H) The "Response Matrix Files" (line response function, and enclosed energy fraction) for HEG grating. " " is a diffraction order, either -1 or 1. meg_ .rmf (H) The "Response Matrix Files" (line response function, and enclosed energy fraction) for MEG grating. " " is a diffraction order, either -1 or 1. leg_ .rmf (L) The "Response Matrix Files" (line response function, and enclosed energy fraction) for LETG grating. " " is a diffraction order, -8 to 8 (excluding 0). -
LTC lc The light curve (FITS binary table). lc_bg The background light curve (FITS binary table). -
PHA pha2 The binned spectrum (FITS binary table, "Type II PHA" file). pha2_bg(L) Binned background (FITS binary table, "Type I PHA" file); summed positive an negative orders. pha2_bg_-1 (L) Binned background (FITS binary table, "Type I PHA" file); negative orders. pha2_bg_1 (L) Binned background (FITS binary table, "Type I PHA" file); positive orders. -
SUM summary.tbl Selected summary information, ASCII file. Contains some fields from the event file header (e.g., object, date), and some source properties (count rates) summary_flux_overview.ps Overview flux spectrum plot (see the Guide to the Plots) summary_fprops.fits Flux properties (FITS binary table). Contains counts and rates summed in bands. For coarse characterization. summary_[hm]eg_123.fits (H) Order sorting image (FITS image), for all photons. See the "Guide to the Plots" for a description. summary_[hm]eg_all.fits (H) Order sorting image (FITS image), for filtered, binned photons. See the "Guide to the Plots" for a description. summary_im-a.ps Summary image; source region detail (See the "Guide to the Plots" for a description.) summary_im-b.ps Summary image; sky field image (See the "Guide to the Plots" for a description.) summary_im_osum.ps (H) Summary image; order-sorting image (See the "Guide to the Plots" for a description.) summary_imsp.ps Summary image; spectral-spatial image (See the "Guide to the Plots" for a description.) summary_lc.ps Summary plot; light curve (See the "Guide to the Plots" for a description.) summary_spc.ps Summary plot; counts (See the "Guide to the Plots" for a description.) summary_spf.ps (H) Summary plot; flux (See the "Guide to the Plots" for a description.)