Known Bugs
If any bugs are found that are not listed below, please send any comments or updates to the TGCat administrator at tgcat@space.mit.edu.
Unable to click on plotting parameter boxes
TGCat allows users to plot spectra with either default parameters or saved parameters.
Once a plot is loaded, a dropdown screen allows users to modify the plot parameters to best highlight
any desired features of the spectrum.
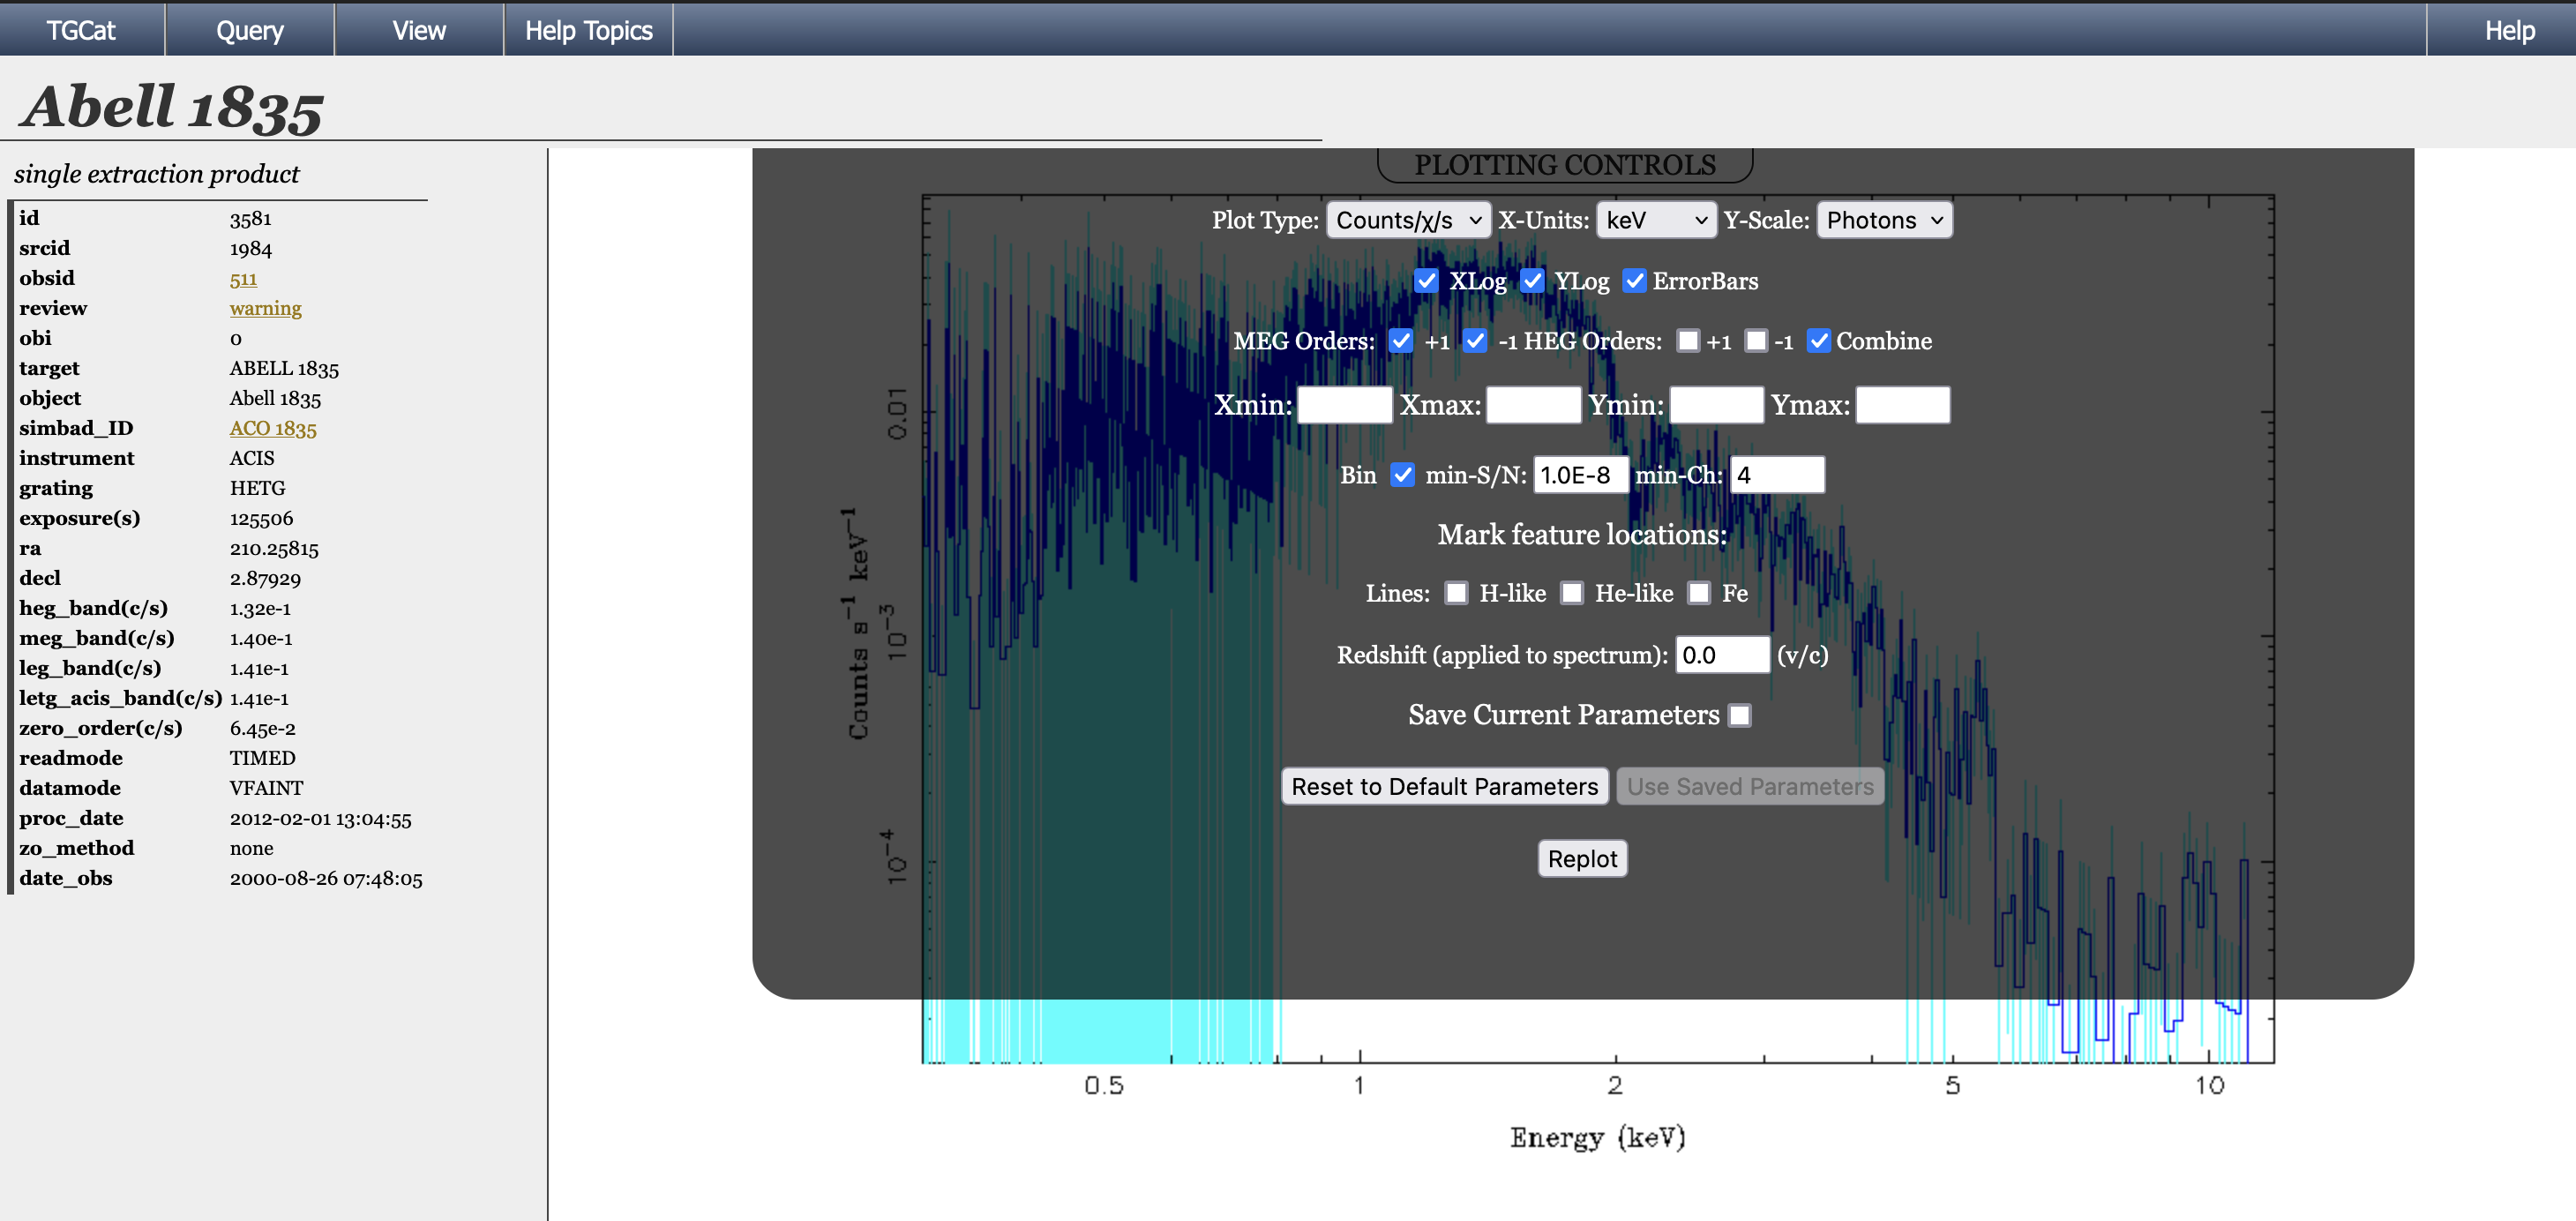
The plotting parameters in the dropdown menu should be accessible by either clicking on the options with a mouse
or tabbing through via keyboard. However, some browsers or operating systems, or security settings do not allow
the four plot range parameters (Xmin, Xmax, Ymin, Ymax) to be editable by simply clicking the box.
First press the 'TAB' key and then a mouse click can be used to select the desired box.
Blank Plotting parameters
Some browsers on some platforms do not properly display the ploting controls menus --- they sometimes are blank. Try any of the following:
- Open the plot in a new window.
"View -> Custom Plotting -> Open Plotter (new window)"
- Hover over a field to see if a "tool tip" identifies the field (such
as the "Plot Type").
- Select an item, then re-display the Plotting Controls to see if
the current selection shows
- Try using a different browser.
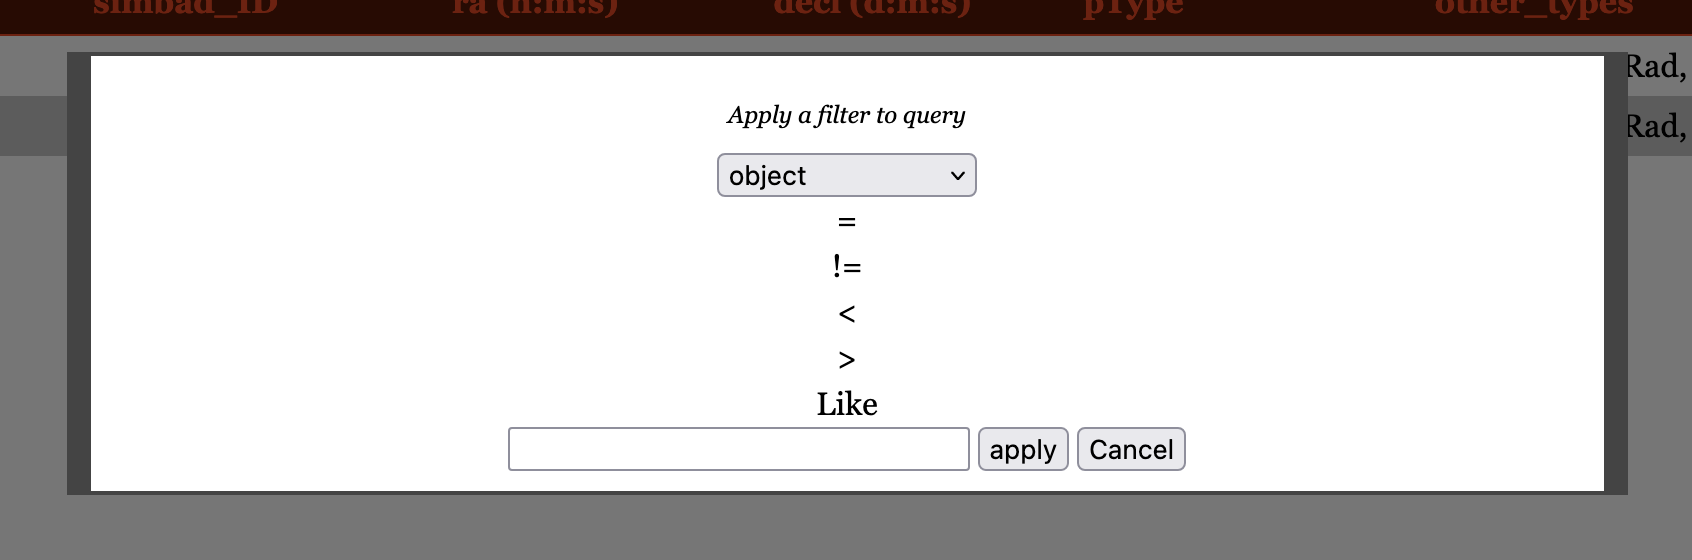
Search results Filter doesn't function
When a search returns more than one result, the user has the option to filter the results based on certain criteria. To find the filter:- Click on the "Actions" tab at the top menu and then the "Filter Results" option
"Actions -> Filter Results "